
Can a DNA Language Model Tell You Where a Gene Starts?
Explore Darwin →Quick Summary
We tested whether an AI model that reads DNA could help us judge which predicted gene-control links in the GRN Atlas are real. We ran 1,500 DNA snippets from five species (three plants, two mammals) through Goodfire’s tool for looking inside the Evo2 model, and set it 23 separate sorting tests.
Key findings (scores are AUC: 0.5 is coin-flip guessing, 1.0 is perfect sorting):
- The tool mainly recognizes which branch of the tree of life a piece of DNA comes from; it does not predict where regulator proteins attach
- Telling the DNA at the start of a gene (the promoter) from the gene itself works well in plants and fades in mammals: arabidopsis 0.889, potato 0.763, rice 0.636, human 0.545, mouse 0.500
- Telling species apart gets easier the more distantly related they are: every plant–animal pair and every broadleaf–grass pair 1.000, two broadleaf plants 0.906, human vs mouse 0.774
- It cannot tell whether a gene is switched on or off by its regulator: 0.506 with 50 genes of each kind
Repository: github.com/cairninstitute/grn-atlas
Boundary statement: “The SAE validation uses atlas-curated gene annotations and sequence coordinates. The classification AUCs reported here measure the SAE’s internal representations, not GRN Atlas edge quality.”
The Experiment
Evo2 is an AI model that has read the DNA of 128,000 genomes from across the tree of life. Much as a chatbot learns the patterns of language from text, Evo2 learns the patterns in the As, Cs, Gs and Ts of raw nucleotide sequences. Goodfire built a tool for looking inside it, called a sparse autoencoder (SAE). The SAE translates what Evo2 is ‘thinking’ midway through reading a sequence into a dictionary of 32,768 recognizable features. At most 64 of them switch on for any one sequence, so each sequence gets a short, readable fingerprint.
We wanted to know whether those fingerprints help map how genes control one another, a so-called gene regulatory network. Can the SAE tell a promoter (the stretch of DNA just before a gene, where its on/off switches sit) from the gene itself, or from the filler DNA between genes? Can it tell species apart? And the question we cared about most: can it tell whether a regulator protein, called a transcription factor, switches its target gene on or off?
To find out, we tested 1,500 short DNA snippets, 200 letters each, from five species: Arabidopsis thaliana (thale cress, a small weed that is the lab mouse of plant biology), Solanum tuberosum (potato), Oryza sativa (rice), Homo sapiens (human) and Mus musculus (mouse). For each species we took 100 promoters, 100 stretches from the start of genes, and 100 random stretches from between genes. We ran every snippet through Evo2 on a desktop graphics card, read out its SAE fingerprint, and checked whether a simple statistical classifier could use the fingerprints to sort the snippets into the right groups. We score each test with AUC, which runs from 0.5 (no better than a coin flip) to 1.0 (perfect sorting).
The Phylogenetic Gradient
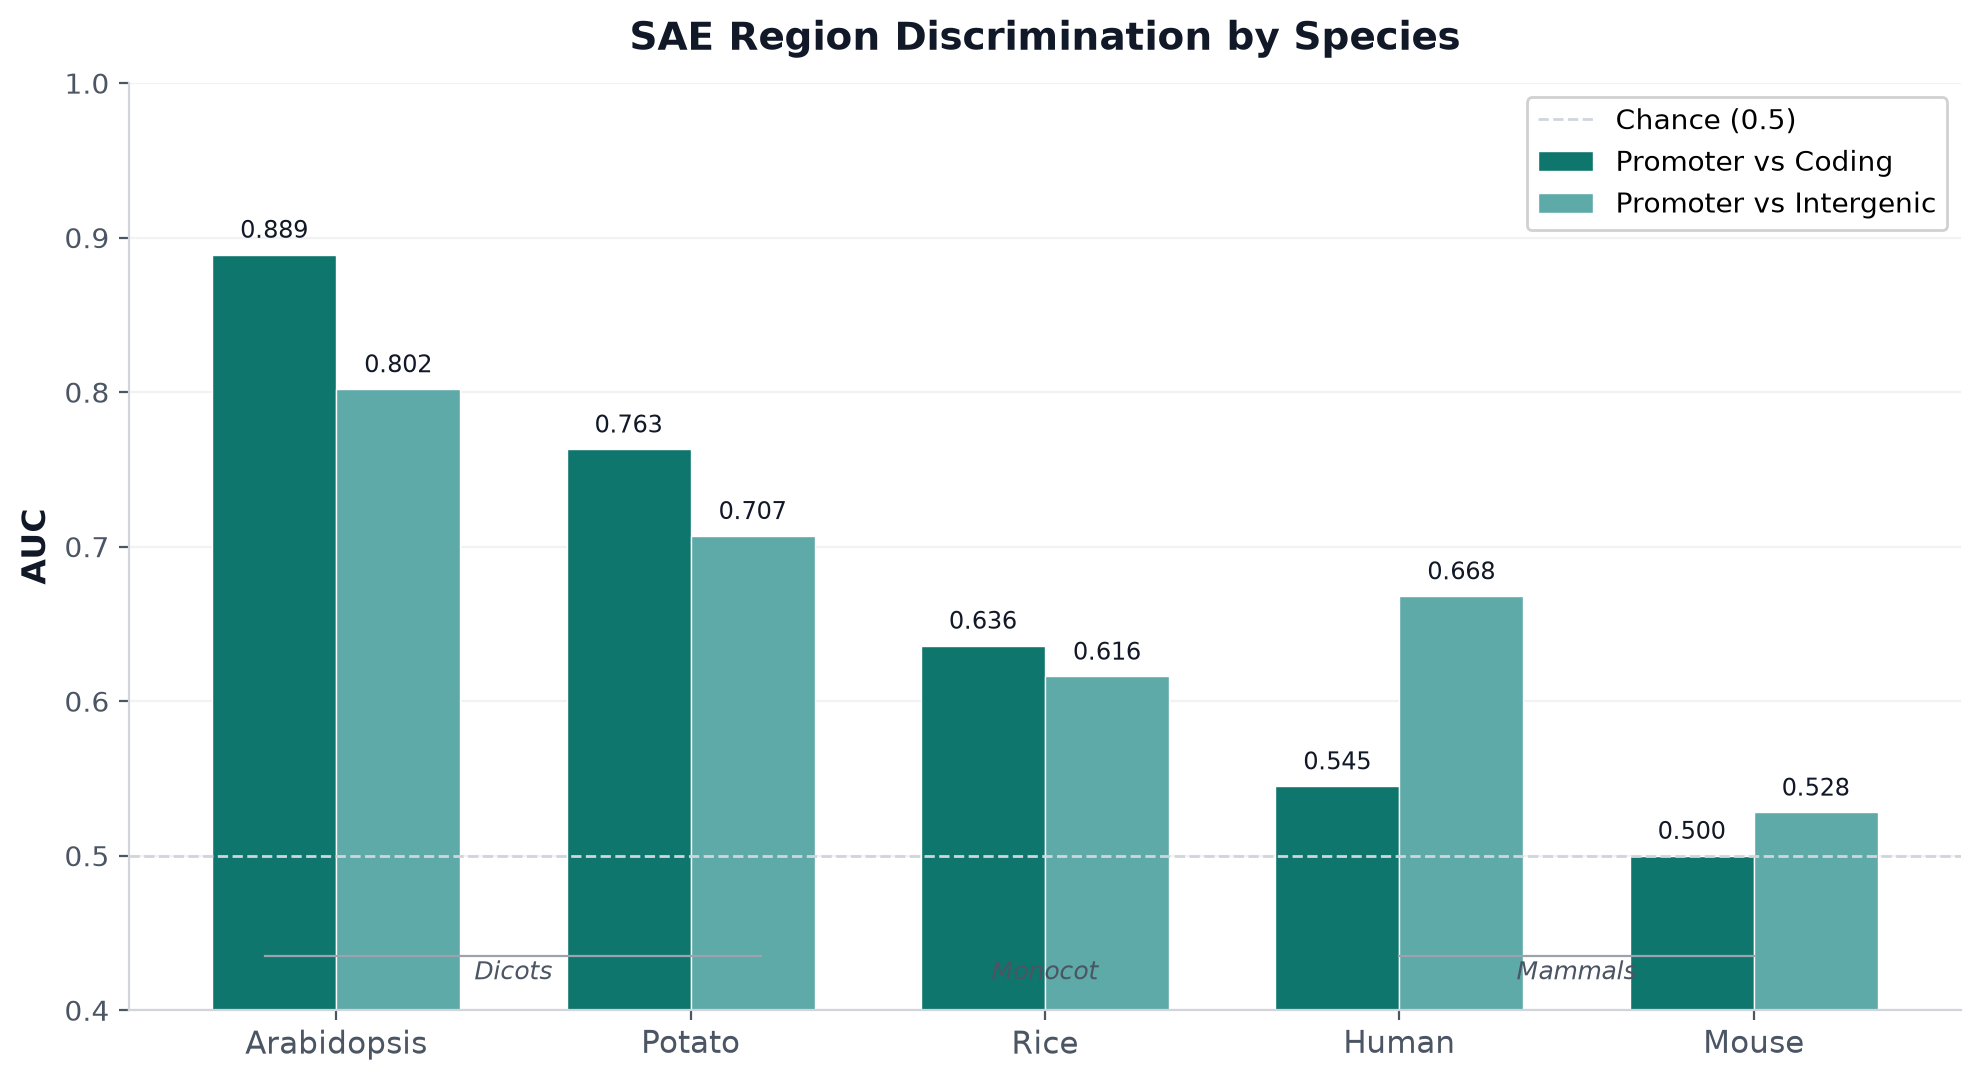
The pattern is striking. In arabidopsis, the SAE separates promoters from gene bodies well (AUC 0.889) and from between-gene DNA nearly as well (0.802). Potato, another broadleaf plant (a dicot), follows close behind (0.763 and 0.707). Rice, a grass (a monocot), drops to 0.636 and 0.616. In mammals the signal nearly vanishes: human scores 0.545, barely above chance, and mouse 0.500, a coin flip.
This is not a failure of the method; it tells us what Evo2 learned. Trained on genomes from across the tree of life, its features sort DNA first by kingdom, then by narrower family group, and only then by the kind of DNA within a genome. Plant promoters carry distinctive landmark sequences, such as the TATA box, that make them stand out from the DNA around them. Mammalian promoters are often built from stretches rich in the letters C and G, and look much more like their surroundings.
The practical upshot: for the plants in the GRN Atlas, the SAE can reliably tell what kind of DNA it is looking at. For mammals, it cannot.
Telling Species Apart Gets Easier with Evolutionary Distance
We also tested whether the SAE can tell species apart. We took 50 promoter sequences from each species and ran all 10 pairwise comparisons.
| Pair | Relationship | AUC | Features that differ strongly (d > 0.8) |
|---|---|---|---|
| Arabidopsis vs Human | Plant vs Animal | 1.000 | 6,020 |
| Arabidopsis vs Mouse | Plant vs Animal | 1.000 | 6,015 |
| Arabidopsis vs Rice | Dicot vs Monocot | 1.000 | 5,367 |
| Rice vs Potato | Monocot vs Dicot | 1.000 | 5,302 |
| Mouse vs Rice | Animal vs Plant | 1.000 | 5,056 |
| Human vs Rice | Animal vs Plant | 1.000 | 4,896 |
| Human vs Potato | Animal vs Plant | 1.000 | 5,941 |
| Mouse vs Potato | Animal vs Plant | 1.000 | 6,327 |
| Arabidopsis vs Potato | Dicot vs Dicot | 0.906 | 345 |
| Human vs Mouse | Mammal vs Mammal | 0.774 | 3,565 |
Every plant–animal pair is perfectly separable, and so is every broadleaf–grass pair. Within a group the picture changes: arabidopsis vs potato (both broadleaf plants, separated by roughly 100 million years of evolution) drops to AUC 0.906, and human vs mouse (both mammals, which split about 90 million years ago) reaches only 0.774.
The number of telling features says the same thing. Comparing a plant with an animal, over 5,000 of the 32,768 features differ strongly between the two (an effect size, Cohen’s d, above 0.8). Comparing two broadleaf plants, only 345 do. In effect, the SAE has drawn its own family tree, and how finely it separates two species tracks how long ago they diverged.
The Question That Mattered Most: Activator or Repressor?
For mapping gene networks, the most valuable prediction would be the sign of each link: does a transcription factor switch its target gene on (activate it) or off (repress it)? If an AI could read that from the DNA in front of a gene, it would change how these networks are built.
It cannot.
We gathered promoters from genes whose response is known from experiments that actually switched a regulator on or off and measured what happened: 50 switched-on and 50 switched-off targets in arabidopsis, and the same in human. Then we asked whether the SAE features could tell the two groups apart.
| Species | Activator targets | Repressor targets | AUC | Verdict |
|---|---|---|---|---|
| Arabidopsis | 50 | 50 | 0.506 | No signal |
| Human | 50 | 50 | 0.570 | No signal |
| Mouse | 2 | 2 | — | Insufficient data |
Arabidopsis AUC of 0.506 is as close to chance as a biological experiment gets. Human at 0.570 is noise — well within the range expected from random sampling at this size.
This is not a shortcoming of the SAE; it reflects how biology works. Whether a transcription factor switches a gene on or off is not written in that gene’s promoter DNA. It depends on the factor itself, the helper proteins it works with, how tightly the DNA is packaged, and what the cell is doing. The same promoter can be switched on by one factor and off by another. The sign belongs to the interaction, not the sequence.
This result closed a door we had hoped to open. But it closed it firmly. Promoter sequence alone cannot tell you whether a gene is being switched on or off.
The Small-Sample Trap
Before the full-scale test, we ran small pilot experiments with 20 sequences per group. The results looked spectacular: a perfect AUC of 1.000 for telling arabidopsis promoters from gene bodies, with 6,203 features that seemed to differ strongly. We nearly stopped there.
We should not have believed it.
| Metric | n = 20 per class | n = 100 per class |
|---|---|---|
| Promoter vs Coding AUC | 1.000 | 0.889 |
| Features that differ strongly (d > 0.8) | 6,203 | 11 |
| Largest effect size (Cohen’s d) | 3.4 | 1.1 |
With only 20 snippets per group and 32,768 features to choose from, a classifier can almost always find some combination that sorts the groups perfectly, even if the groups were assigned at random. Tuning the classifier hid the problem: at its strictest setting it found nothing, and at a slightly looser one it seemed to find real structure. But at that sample size, ‘real structure’ meant memorizing 40 examples using tens of thousands of measurements.
The count of seemingly important features was inflated even more. At 20 per group, over 6,000 features appeared to differ strongly; at 100 per group, only 11 held up. The other 6,192 were chance fluctuations, which look large when samples are small.
This is a warning for anyone using sparse autoencoders or similar tools that produce thousands of measurements per sample. With 32,768 features and 40 samples, you are not doing statistics; you are finding patterns in noise. The fix is simple and old: get more data. Our full validation used 200 sequences per test (100 per group), and its results, though less dramatic, are the ones we trust.
What This Means for GRN Atlas
The GRN Atlas holds 162,000 predicted gene-control links across eight species. We tested the Evo2 SAE as one possible way to score them: for each predicted link, how likely is it that this transcription factor really attaches to this gene’s promoter?
The SAE answered a different question than we asked, but the answer is still useful.
For plants, especially broadleaf species, the SAE can serve as a quality check on DNA. Given a 200-letter snippet, it can confirm whether it looks like a promoter, a gene body or between-gene DNA, with AUCs of 0.76–0.89 depending on species. That is useful before running slower, costlier analyses: if a sequence that should be a promoter looks like a gene body, something went wrong earlier in the pipeline.
For predicting where transcription factors attach, we are looking elsewhere. Enformer, Google DeepMind’s model of how DNA is packaged and read, shows binding signal specific to individual transcription factors in human (overall AUC 0.518 in large-scale validation, stronger for a few well-studied factors), but it does not cover plants. For plants, scanning for known binding motifs, the short DNA patterns catalogued in the JASPAR database, works best: AUC 0.795 in arabidopsis (motif hits in 59% of real targets versus 0.2% of random genes) and 0.715 in petunia.
For the sign of each link, on or off, experiments that disturb a gene and measure the response remain the only reliable source. None of the DNA-based approaches we tested could predict it: not the SAE, not Enformer, not the molecular-structure predictor Boltz-2, and not simple classifiers trained directly on Evo2’s internal signals. That fits the biology: the same promoter responds differently to different transcription factors, so the sign comes from the interaction, not the sequence.
The SAE taught us something we did not expect. A DNA language model trained on raw genomes across the tree of life builds an internal phylogenetic map. Its features carve sequence space along evolutionary lines so precisely that two promoters from different kingdoms are as distinguishable as two different languages. Within that map, it reads the grammar of plant genomes more fluently than animal ones — a bias that likely reflects the composition of its training data and the distinctiveness of plant promoter architecture. It is a genome reader, not a regulation predictor. But for a project that works across eight species and needs to trust its sequences, a genome reader that knows what kingdom it is looking at is not a bad tool to have.
What This Shows — and Does Not Show
Demonstrates:
- The Evo2 SAE encodes phylogenomic composition with a gradient that tracks real evolutionary distance
- Region discrimination is strong for dicot plant species (AUC 0.889) and weak to absent for mammals (AUC 0.500)
- Small-sample inflation in high-dimensional feature spaces is severe and must be controlled with adequate sample sizes
- Regulatory sign is not encoded in promoter sequence alone
Does not demonstrate:
- That the SAE can predict TF-DNA binding, binding location, or regulatory function
- That Evo2’s representations are useful for GRN inference beyond sequence quality filtering
- That the phylogenetic gradient generalizes beyond the five species tested
Sequence composition is not regulatory function. The SAE reads what the DNA is, not what it does.
References
- Nguyen et al. (2024), Sequence modeling and design from molecular to genome scale with Evo — Arc Institute; arcinstitute.org/tools/evo
- Goodfire (2024), Sparse Autoencoders for Evo2 — goodfire.ai
- Castro-Mondragon et al. (2022), JASPAR 2024: open-access database of transcription factor binding profiles — jaspar.elixir.no
- Avsec et al. (2021), Effective gene expression prediction from sequence by integrating long-range interactions — doi:10.1038/s41592-021-01252-x